
Five-year-old workforce data or, worse yet, costly, hard-to-access data became a stick wedged in the wheel of progress for early-stage company founders and civic planners in Nebraska. The 2024 Statewide Nebraska Quarterly Workforce Indicators Dashboard, a partnership between SourceLink and SourceLink Nebraska, addressed the challenge of generating accurate real-time reports based on current entrepreneur-focused data.
Data Disparity
Local companies, innovation-driven startups, and entrepreneurs drive job creation and community-based growth. In fact, small businesses with fewer than 50 people on the payroll, account for more than 40 percent of U.S. employment and 96 percent of all establishments, according to the Quarterly Census of Employment and Wages from the Bureau of Labor Statistics. [Source]
However, new and young firms don’t necessarily have deep financial resources or the knowhow to locate timely, useful data. Economic planning and operational decisions based on subpar data results in less optimal outcomes. Further, the existing data was difficult to parse and interpret for effective decision-making.
“Available data lags five or more years,” says Rob Williams, Director of SourceLink. “Virtually no reliable source for self-employed data exists, except through expensive paid databases, or proprietary and difficult-to-access sources.”
A consistent pattern emerged across markets: communities were surrounded by data and still operating without clarity.
Through direct engagement with ecosystem partners, client work, and its own market analysis, SourceLink saw the same issue repeatedly.
“Leaders were making decisions without a shared, trusted view of entrepreneurial activity at a level precise enough to guide action. This was not a single request. It was a systemic gap. The dashboard is a direct response to that blind spot,” says Williams.
With the gap identified and defined, the next phase of work began.
What makes the Entrepreneurship Workforce Indicators Dashboard different?
SourceLink, a national program based out of the University of Missouri-Kansas City, and SourceLink Nebraska, a program of the University of Nebraska, produced an innovative dashboard unlike other workforce models. First of its kind in the state, the dashboard gathers, visualizes and reports key entrepreneurship data often difficult or expensive to source.
SourceLink extracted data using Quality Workforce Indicators (QWI) Census data and presented it in an actionable dashboard. The tool enables users to prepare compelling data-driven stories and reports that inform decision making and support economic development.
“The foundation for developing this dashboard draws on years of work in markets like Kansas City, while the Nebraska deployment required focused refinement to align the data model, strengthen usability, and ensure local relevance,” says Williams. “The timeline reflects disciplined iteration over multiple months, built on a system that has been evolving for years.”
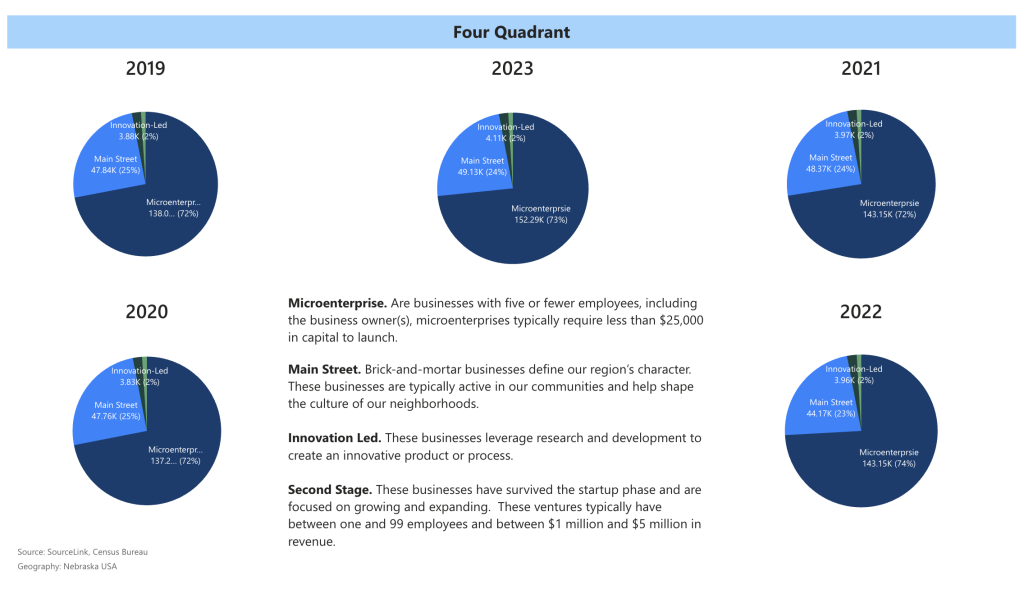
Let’s look under the hood.
The Workforce Indicators Dashboard is built on federal QWI data that translates complex workforce and entrepreneurship signals into decision-ready insight.
The dashboard continuously integrates workforce and business data to reveal patterns over time rather than isolated snapshots. Economic developers and leaders can track shifts in
- Employment
- Firm growth
- Entrepreneurial activity
Further, dashboard users can view data in reports that span industries, allowing them to see trajectories as they form.
“The power is not just in the data, but in how it is structured and visualized to surface movement, comparison, and emerging signals, giving ecosystem leaders a clear view of where Nebraska stands and where it is heading,” says Scott Asmus, SourceLink Nebraska Program Director. “This data helps us look beyond
individual communities or programs and better understand Nebraska’s collective
statewide performance. It reflects how communities across the state are working
together as an entrepreneurial ecosystem to support business growth, drive
entrepreneurship, and create jobs.”
Instead of static reports or lagging indicators, it provides a living view of how businesses form, grow, and connect to talent across Nebraska.
Better Data Provides Clearer View
Now users can plan and make key economic decisions based on real-time actionable information that reflects actual conditions and trends in a community or region.
“The dashboard gives economic developers, ecosystem builders, and institutional partners the ability to see where entrepreneurial activity is accelerating, where it is constrained, and where targeted action can unlock growth,” said Krista Markley, Business Development Director for SourceLink.
As a development partner, SourceLink Nebraska knew that civic planners statewide at all levels of government didn’t simply need more data. Users needed practical reports specific to entrepreneurs and firms that create jobs, information they could act on to accelerate local economic growth.
“The dashboard gives Nebraska’s local and state leaders a clearer way to understand
how the state is performing in entrepreneurship and how we compare nationally,” says Asmus. “Because entrepreneurship does not happen in isolation, this data helps city, county, regional, and statewide leaders see how their work contributes to a broader ecosystem that supports business growth, job creation, and long-term economic development.”
Economic Development Supported By Data and Insight
The dashboard moves economic development from reactive to predictive. No more lagging indicators. No more fragmented reports. No more feeling stuck in place.
“Leaders can see where entrepreneurial energy is forming, where it is being constrained, and where intervention will have the greatest impact,” says Williams. “The result is more precise investment, stronger alignment, and faster learning across the ecosystem. The outcome is better decisions, made earlier, with greater confidence.”
Importantly, the dashboard is built for network use. Its intuitive, ready-to-use model can be licensed by other economic development institutions across the United States. The rollout of the dashboard developed for Nebraska joins similar dashboard and reporting projects SourceLink completed in Kansas City and across Missouri.
To learn more about how SourceLink can do this work in your community, contact Krista Markley, kmarkley@joinsourcelink.com. To explore how the new dashboard can support local entrepreneurship development, contact Scott Asmus at SourceLink Nebraska, sasmus@unomaha.edu.